

Total COVID-19 Deaths in the United States
The cumulative toll of COVID-19 in the United States is staggering by any measure. Based on death certificate data from the CDC’s National Vital Statistics System (NVSS), approximately 1.17 million deaths were attributed to COVID-19 (as underlying or contributing cause) from 2020 through 2023. [1] The year-by-year breakdown:
However, death certificate counts likely underestimate the true toll. The Global Burden of Disease (GBD) 2023 study estimated 1.21 million total COVID-19 deaths (95% UI: 1.10–1.27 million) in the U.S. through 2023, placing the country second globally behind India. [6] Excess mortality analyses paint an even broader picture: an estimated 1.28 million excess deaths occurred between March 2020 and July 2023, with almost 90% attributed to COVID-19. [7] An estimated 24% of COVID-19-attributable deaths during 2020–2021 were never documented on death certificates. [8] Adding ongoing deaths in 2024 and beyond, the cumulative total likely exceeds 1.2 million.
What the vaccination campaign achieved
The U.S. COVID-19 vaccination campaign is estimated to have prevented more than 3 million additional deaths and more than 18 million additional hospitalizations through June 2023. [9] More granular modeling studies corroborate this:
December 2020–September 2021: CDC modeling estimated vaccination prevented approximately 235,000 deaths (95% UI: 175,000–305,000) among vaccinated adults ≥18 years. By September 2021, vaccination was preventing an estimated 58% of expected COVID-19 deaths. [10]
December 2020–June 2021: An agent-based model estimated the campaign saved 240,797 lives (95% CrI: 200,665–281,230). Had vaccination proceeded at half the actual pace, an additional 77,283 deaths would have occurred. [11]
Deaths directly attributable to non-vaccination
The study most directly addressing the question of “needless” deaths is **Jia et al. (European Journal of Epidemiology, 2023), which estimated that at least 232,000 COVID-19 deaths could have been prevented among unvaccinated U.S. adults during just the 15-month period from May 2021 to September 2022, had those individuals received at least a primary vaccine series. The authors emphasize this is a [12]lower-bound estimate given their conservative methodology.
This figure covers only a fraction of the pandemic’s post-vaccine timeline. When considering the full period from vaccine availability (December 2020) through 2024, the number of preventable deaths attributable to non-vaccination is substantially higher.
The mortality gap: unvaccinated vs. vaccinated
The risk differential was enormous and consistent across the pandemic:
PeriodUnvaccinated Death Rate vs. VaccinatedDelta (Oct–Nov 2021)53× higher than boosted individuals [1]Delta (Oct–Nov 2021)13× higher than primary series only [1]Late Omicron BA.4/BA.5 (2022)14× higher than bivalent boosted [2]Omicron (Feb 2022–Jan 2023)VE against death: 62–69% [3]
Vaccine effectiveness against death remained 90% overall (88% for 2 doses, 94% for 3 doses) through January 2022, and even at ≥365 days post-vaccination, VE against invasive mechanical ventilation or death was still 56%. [1][15]
Geographic and political correlates of vaccine refusal
The consequences of non-vaccination were not evenly distributed. Over half (51.5%) of all U.S. excess pandemic deaths occurred after vaccines became available. [7] Excess death rates were significantly higher in states with lower vaccination uptake. [16] A landmark study linking voter registration to mortality records in Florida and Ohio found that after vaccines became widely available (May 2021), Republican voters had a 43% higher excess death rate than Democratic voters — a gap that was larger in counties with lower vaccination rates and was not present before vaccine availability. [1] Separately, an estimated 76% of non-vaccination was attributable to vaccine hesitancy rather than access barriers. [1]
Important Caveats
These estimates carry meaningful uncertainties. Observational data cannot fully account for differences between vaccinated and unvaccinated populations — vaccinated individuals tend to be healthier at baseline (the “healthy vaccinee bias”), which may inflate apparent vaccine-preventable death estimates. [1] Counterfactual models assume the epidemic trajectory would have been similar without vaccination, but behavioral changes and variant evolution would likely have differed. Additionally, vaccine effectiveness waned over time and varied by variant, making single-number estimates sensitive to the time period analyzed. [1]
Summary
Approximately 1.2 million Americans have died from COVID-19 through 2023, with the true toll likely higher when accounting for undercounting. The U.S. vaccination campaign prevented an estimated 3+ million additional deaths. [9] Among those who did die, at least 232,000 deaths during a 15-month window alone were directly preventable had unvaccinated adults received a primary vaccine series — and the total number of preventable deaths across the full post-vaccine period is almost certainly far larger. [12] The mortality rate among unvaccinated individuals was consistently 5 to 53 times higher than among vaccinated individuals depending on the variant period and booster status. [13-14]
JAMA Internal Medicine. 2026. Koumans EHA, Khan D, Trejo I, et al.New
COVID-19 Mortality Update - United States, 2022.
MMWR. Morbidity and Mortality Weekly Report. 2023. Ahmad FB, Cisewski JA, Xu J, Anderson RN.
Provisional Mortality Data - United States, 2020.
MMWR. Morbidity and Mortality Weekly Report. 2021. Ahmad FB, Cisewski JA, Miniño A, Anderson RN.
Lancet. 2025. GBD 2023 Causes of Death Collaborators.NewModeling
Disparities in COVID-19 Mortality in the United States, 2020-2023.
BMC Public Health. 2025. Abidin ZU, Thirumalareddy J, Gupta JS, Abdul Jabbar AB.New
Provisional Mortality Data - United States, 2022.
MMWR. Morbidity and Mortality Weekly Report. 2023. Ahmad FB, Cisewski JA, Xu J, Anderson RN.
Provisional Mortality Data - United States, 2021.
MMWR. Morbidity and Mortality Weekly Report. 2022. Ahmad FB, Cisewski JA, Anderson RN.
Excess Death Rates by State During the COVID-19 Pandemic: United States, 2020‒2023.
American Journal of Public Health. 2024. Woolf SH, Lee JH, Chapman DA, Sabo RT, Zimmerman E.
Lancet. 2022. COVID-19 Excess Mortality Collaborators.SR
eLife. 2023. Lee WE, Woo Park S, Weinberger DM, et al.

Lancet Regional Health. Americas. 2021. Iuliano AD, Chang HH, Patel NN, et al.
Lancet. 2023. Bollyky TJ, Castro E, Aravkin AY, et al.Observational
Mortality in the United States - Provisional Data, 2023.
MMWR. Morbidity and Mortality Weekly Report. 2024. Ahmad FB, Cisewski JA, Anderson RN.
MMWR. Morbidity and Mortality Weekly Report. 2020. Rossen LM, Branum AM, Ahmad FB, Sutton P, Anderson RN.
Excess Deaths in the United States During the First Year of COVID-19.
Preventive Medicine. 2022. Ruhm CJ.
American Journal of Epidemiology. 2024. Kandula S, Kristoffersen AB, Rø G, LeBlanc M, de Blasio BF.New
COVID-19 Vaccine-Preventable Mortality Across Demographic Groups in the United States
Scope and Framing
This review synthesizes evidence on how COVID-19 deaths preventable through vaccination were distributed across age, race/ethnicity, geography, political affiliation, and socioeconomic status in the United States. While the U.S. vaccination campaign prevented an estimated 3+ million deaths overall, the burden of preventable deaths — those that occurred among unvaccinated individuals who could have been vaccinated — fell disproportionately on specific populations. Critically, no single national study provides a fully stratified breakdown of preventable deaths across all demographic dimensions simultaneously; the evidence presented here is assembled from multiple complementary analyses.
Age
The overwhelming concentration in older adults
COVID-19 mortality was profoundly age-stratified. Approximately 75% of all ~1.17 million U.S. COVID-19 deaths occurred among adults aged ≥65 years. [1] In 2023–2024, adults ≥65 comprised only 17.7% of the population but accounted for an estimated 81.2% of COVID-19-associated deaths. [2] The cumulative age-adjusted mortality rate for persons ≥75 years was 71.6 times higher than for those aged 15–44. [1]
Age-stratified deaths prevented by vaccination
The most granular age-stratified estimate comes from **Steele et al. (2022, JAMA Network Open), which modeled deaths prevented among vaccinated adults from December 2020 to September 2021: [3]
Age GroupEstimated Deaths Prevented95% UIDeaths Prevented per 100,000 (Peak Month)≥65 years~154,000105,000–214,00096 per 100,000 (Aug 2021)50–64 years~66,00040,000–94,00051 per 100,000 (Sep 2021)18–49 years~15,00010,000–26,000LowerTotal ≥18~235,000175,000–305,000—
By September 2021, vaccination was preventing an estimated 58% of expected COVID-19 deaths nationally, with the highest percentage prevented in the Northeast (65%) and lowest in the Southeast (52%), driven by regional differences in vaccine coverage. [3]
Mortality rate ratios by age and vaccination status
CDC surveillance across 24–25 U.S. jurisdictions demonstrated that the mortality gap between unvaccinated and vaccinated individuals was enormous across all age groups but varied by age and variant period: [4-5]
PeriodAge GroupUnvaccinated vs. Boosted Death Rate RatioDelta (Oct–Nov 2021)All ages53.2×Late BA.4/BA.5 (2022)65–79 years23.7× (vs. bivalent booster)Late BA.4/BA.5 (2022)≥80 years10.3× (vs. bivalent booster)
Vaccine effectiveness (VE) against death was consistently lower in the oldest age groups (≥80 years) compared with younger adults, and waning was more pronounced in older adults. A meta-analysis of elderly populations found VE against death of RR 0.59 (95% CI 0.47–0.74) for ages 60–79 but only RR 0.76 (95% CI 0.59–0.98) for ages ≥80. [1] In Portugal, VE against death was ~95% for ages 65–79 but ~81% for ages ≥80 during the pre-Delta period. [6]
The paradoxical shift in younger adult mortality
An important finding is that during the Delta wave (July–October 2021), mortality among adults aged 25–54 years increased compared with earlier waves, even as mortality among those ≥85 fell by 68–77%. [7] This reflected lower vaccination rates among younger adults and Delta’s severity, meaning that a disproportionate share of vaccine-preventable deaths during Delta occurred in working-age adults — a population often perceived as low-risk.
Race and Ethnicity
Cumulative mortality disparities
Racial and ethnic minorities bore a staggering disproportionate burden of COVID-19 mortality throughout the pandemic. The cumulative age-adjusted mortality rate (2020–2023) was highest for NH American Indian/Alaska Native (AI/AN) at 154 per 100,000, followed by NH Native Hawaiian/Pacific Islander (NH/OPI) at 124.2, NH Black at 123.9, and Hispanic at 96.0, compared with NH White at 80.5. [1] In Alaska specifically, the age-adjusted COVID-19 mortality rate among AI/AN persons was 2.86 times that among White persons, with the disparity reaching 10.5-fold among those aged 20–29. [8-9]
The following figure from Acosta et al. illustrates the cumulative age-adjusted rates of hospitalization, ICU admission, and in-hospital death by race/ethnicity during the pandemic’s first year, demonstrating the profound disparities across all severity measures.
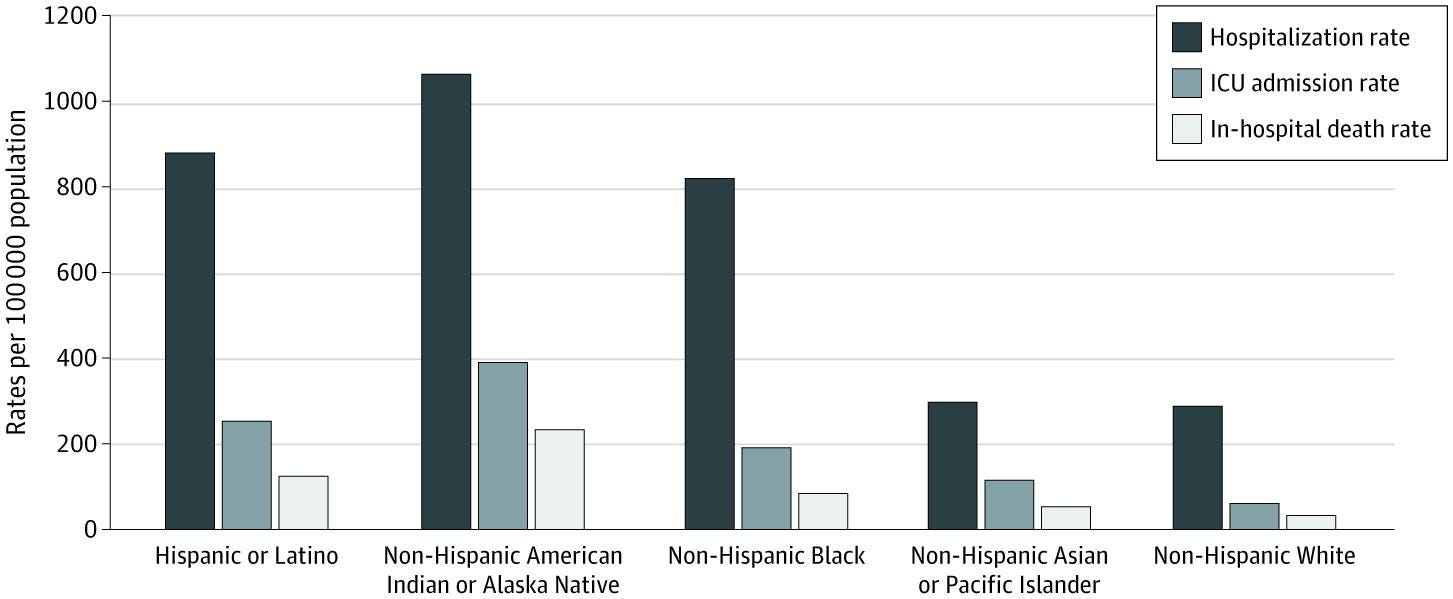
Figure 3. Cumulative Age-Adjusted Hospitalization, Intensive Care Unit (ICU) Admission, and In-Hospital Death Rates by Race and Ethnicity, United States, March 1, 2020 to February 28, 2021
Racial and Ethnic Disparities in Rates of COVID-19–Associated Hospitalization, Intensive Care Unit Admission, and In-Hospital Death in the United States From March 2020 to February 2021. JAMA Netw Open. September 30, 2021.
Content used under license from the JAMA Network®
© American Medical Association
Life expectancy impact
The pandemic’s life expectancy toll was profoundly racialized. In 2020, life expectancy fell 4.5 years for Hispanic males, 3.6 years for Black males, and 1.5 years for White males. [11] The Black-White life expectancy gap increased by nearly 40% (from 3.6 to >5 years), erasing progress since 2006, while the longstanding Hispanic life expectancy advantage nearly disappeared. [12]
The following table from Andrasfay & Goldman quantifies these reductions by race/ethnicity:
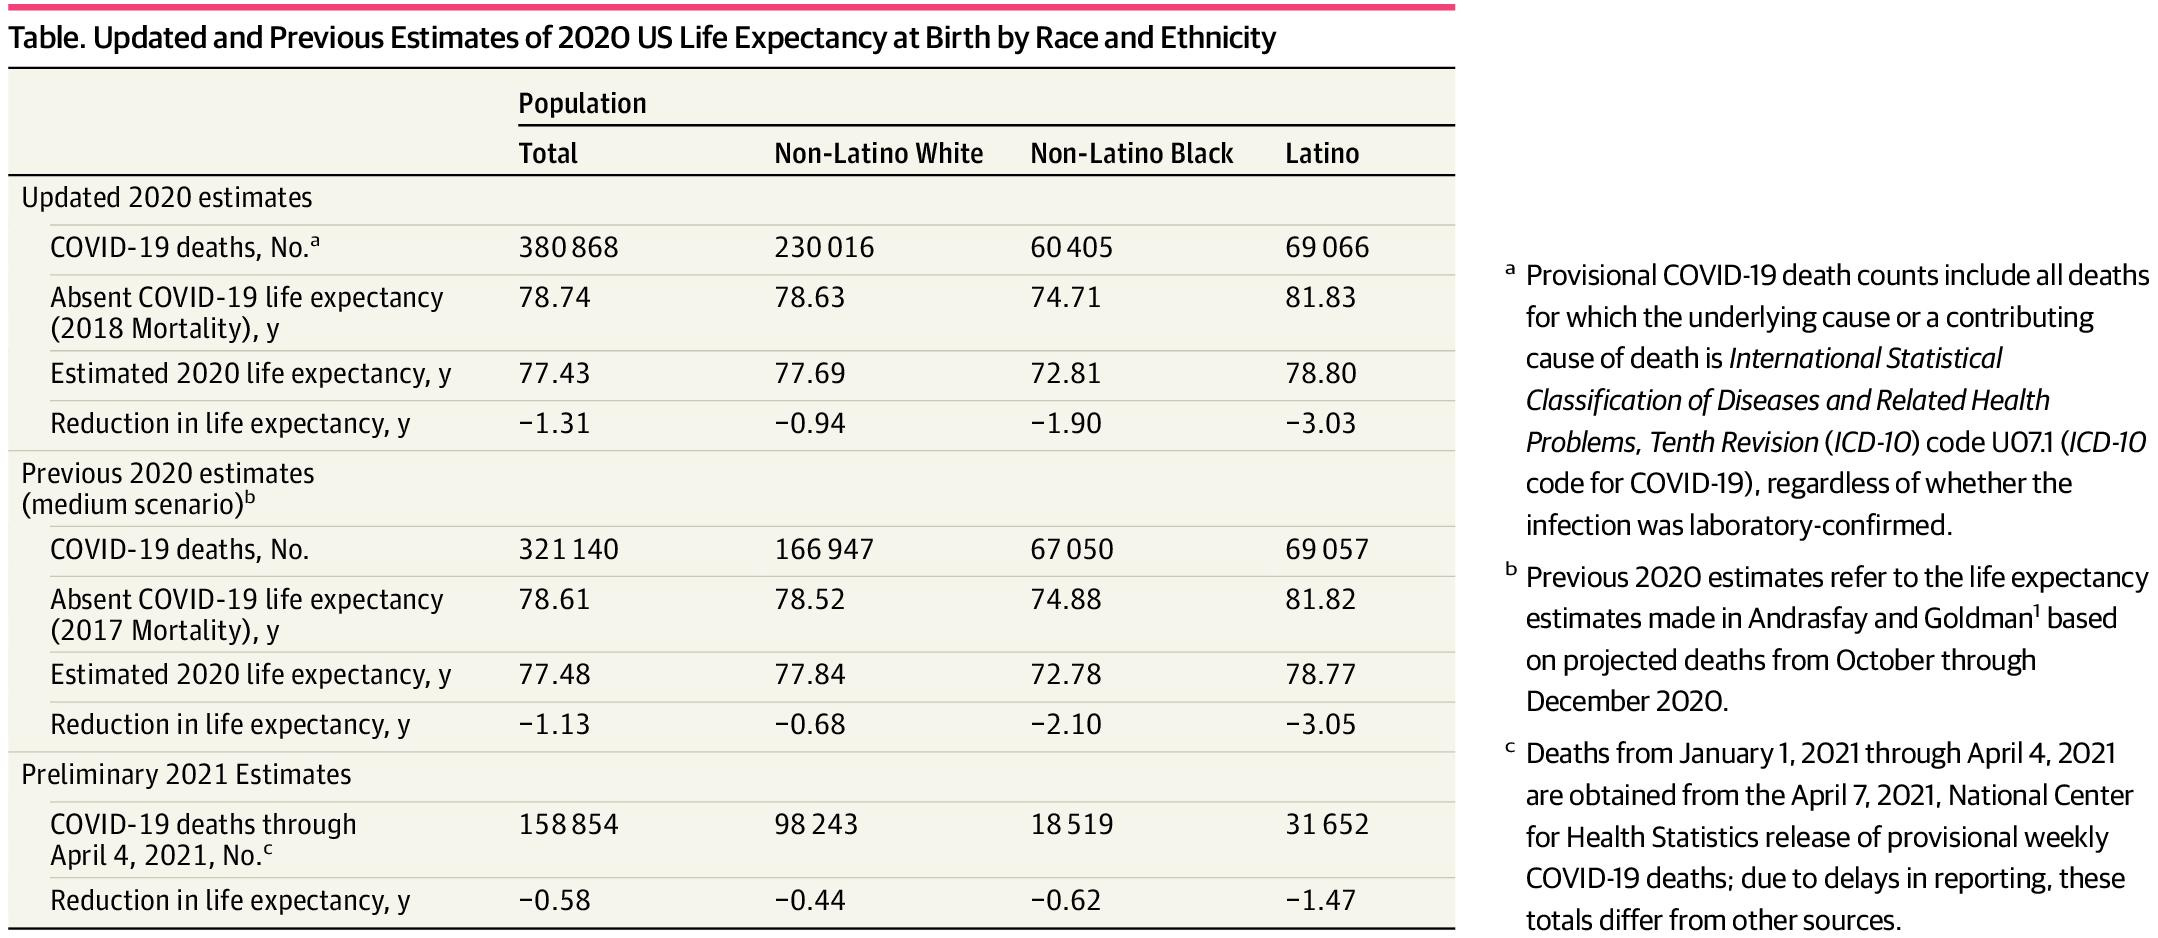
Table. Updated and Previous Estimates of 2020 US Life Expectancy at Birth by Race and Ethnicity
Association of the COVID-19 Pandemic With Estimated Life Expectancy by Race/Ethnicity in the United States, 2020. JAMA Netw Open. May 31, 2021.
Content used under license from the JAMA Network®
© American Medical Association
In 2021, the apparent narrowing of racial disparities was primarily because White populations experienced proportionately greater increases in mortality — not because minority outcomes improved. Life expectancy in Native American and Black populations remained much lower in absolute terms. [14-15]
Vaccination coverage disparities and their evolution
Early in the rollout (April 2021), ≥1-dose coverage was highest among Asian (69.6%) and White (59.0%) adults, and lower among Hispanic (47.3%), Black (46.3%), and AI/AN (38.7%) adults. [16] By November 2021, primary series gaps had largely closed for Black (78.2%) and Hispanic (81.3%) adults relative to White adults (78.7%). [16]
However, booster dose disparities emerged and persisted. By 2022, Black (35.7%) and Latinx (35.5%) adults were significantly less likely to have received ≥3 doses compared with Asian (66.5%) and White (48.8%) adults. [17] This booster gap represents an underappreciated dimension of vaccine-preventable mortality.
Vaccination did not fully eliminate racial disparities
A critical finding is that racial/ethnic disparities in COVID-19 mortality persisted even among vaccinated individuals. Georgia data (through February 2023) showed that NH Black adults had higher COVID-19 death rates than NH White adults (RR 1.37, 95% CI 1.34–1.39) even when stratified by vaccination status. The mortality disparity was eliminated only among those who received a booster dose (RR 0.96, 95% CI 0.86–1.07). [18] Minnesota data showed that Black, Hispanic, and Asian adults aged <65 were more highly vaccinated than White populations of the same ages during Delta and Omicron surges, yet White mortality rates were lower — indicating that structural factors beyond vaccination (occupational exposure, housing density, comorbidity burden, healthcare access) continued to drive excess mortality. [19]
Quantifying race-specific preventable deaths
No national study directly quantifies vaccine-preventable deaths stratified by race/ethnicity. However, one modeling study estimated that vaccinating half of the remaining unvaccinated population (by county, age, and race) would avert an estimated 150,000 deaths over 12 months, with Black and Hispanic/Latino populations projected to experience substantial benefits given their lower vaccination rates and worse outcomes if infected. [20] A JAMA Network Open analysis found that if all groups had experienced the mortality rate of college-educated non-Hispanic White individuals, 48% of all COVID-19 deaths would have been averted, including 71% of deaths among racial/ethnic minorities and 89% of deaths among minorities aged 25–64. [21]
Geographic Region and Rural-Urban Divide
Regional variation
The pandemic’s geographic burden shifted dramatically over time. Early in 2020, ~56% of excess deaths occurred in the Northeast (17% of the population). [22] After May 2020, the burden shifted to the South and Mountain states: the South experienced COVID-19 mortality 26% higher than the national rate, while the Northeast’s rate was 42% lower. [22] If all regions had matched the Northeast’s post-May 2020 mortality rate, an estimated 316,234 deaths were “avoidable,” with 60% of those in the South. [22]
State-level standardized cumulative death rates ranged nearly 4-fold, from 147/100,000 (Hawaii) to 581/100,000 (Arizona). [2]
Rural-urban gap
By January 2022, rural county vaccination coverage (≥1 dose) was 58.5% vs. 75.4% in urban counties — a gap that more than doubled compared to early 2021. [23] During the Delta-Omicron waves, the most remote rural counties had COVID-19 mortality rates 52% higher than the most urban counties. [24] Rural residents had 53–65% higher risk of breakthrough infection compared to urban dwellers. [4] Rural COVID-19 hospitalized patients had 22% higher all-cause mortality (HR 1.22, 95% CI 1.10–1.34) over a median 602-day follow-up. [2]
County-level vaccination-mortality relationship
Multiple studies demonstrate a consistent dose-response inverse association between vaccination coverage and mortality. A BMJ study of 2,558 counties found that a 10% improvement in county vaccination coverage was associated with an 8% reduction in mortality rates (95% CI 8–9%). [2] Counties with ≥80% vaccination coverage had 46% lower death rates (95% CI 38–52%) vs. counties with <50% coverage. [25] During Omicron, low-vaccinated areas (<40%) had 1.6× higher mortality and 2.2× higher case-fatality ratio compared to areas with >60% vaccination. [26]
Political Affiliation
The partisan mortality gap
The landmark **Wallace et al. (2023, JAMA Internal Medicine) study linked voter registration records to mortality data for 538,159 deaths in Florida and Ohio. Before vaccines were available to all adults, there was no significant partisan gap in excess mortality (−0.9 percentage points, 95% PI −2.5 to 0.3). After May 1, 2021, the gap widened to 7.7 percentage points (95% PI 6.0–9.3), meaning Republican voter excess death rates were 43% higher than Democratic voter rates. The gap was larger in counties with lower vaccination rates. [27]
After May 1, 2021, when vaccines were available to all adults, the excess death rate gap between Republican and Democratic voters widened from −0.9 percentage point to 7.7 percentage points in the adjusted analysis; the excess death rate among Republican voters was 43% higher than the excess death rate among Democratic voters.
— Jacob Wallace, PhD1, et al., Yale School of Public Health, New Haven, Connecticut and other institutions
Excess Death Rates for Republican and Democratic Registered Voters in Florida and Ohio During the COVID-19 Pandemic. JAMA Intern Med. August 31, 2023.
Content used under license from the JAMA Network®
© American Medical Association
The following figure from Wallace et al. illustrates how the relationship between county-level vaccination rates and excess death rates diverged sharply by political affiliation only after vaccines became widely available:
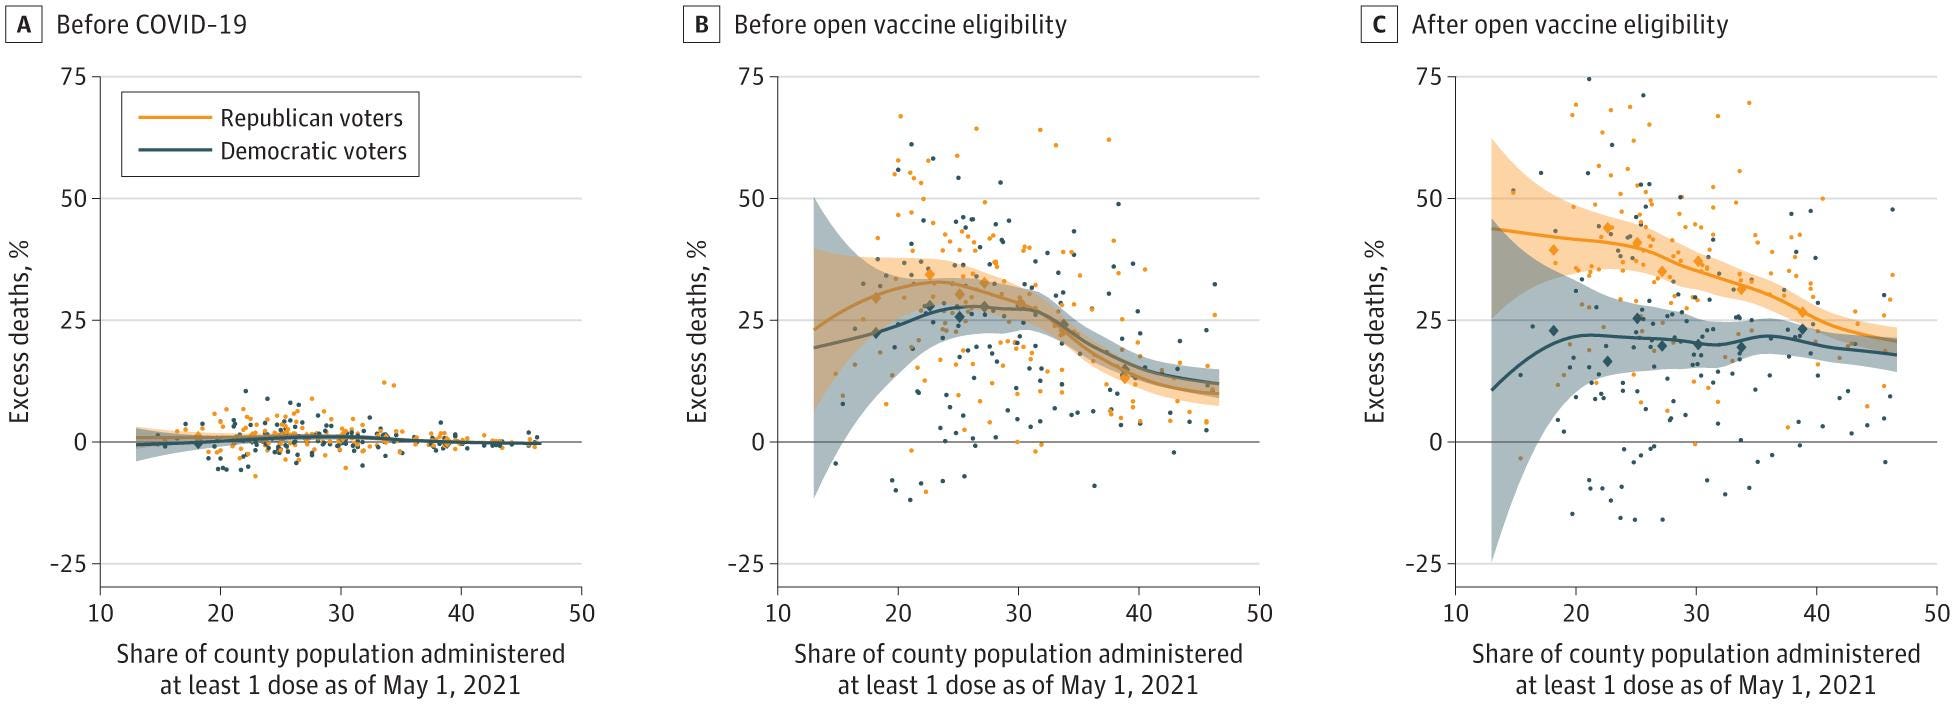
Figure 4. Excess Death Rates and Vaccination Rates in Florida and Ohio During the COVID-19 Pandemic
Excess Death Rates for Republican and Democratic Registered Voters in Florida and Ohio During the COVID-19 Pandemic. JAMA Intern Med. August 31, 2023.
Content used under license from the JAMA Network®
© American Medical Association
At the county level, GOP vote share was strongly negatively correlated with COVID-19 vaccination (r = −0.699, P < .001). Counties in the highest GOP quartile had vaccination rates of 45% vs. 60% in Democratic-quartile counties. [28] Political affiliation was the strongest predictor of county-level percent unvaccinated in comprehensive models, and this association persisted through 2024. [28]
Socioeconomic Status and Social Determinants
Poverty and income
Poverty was one of the strongest predictors of both lower vaccination and higher COVID-19 mortality. Individual-level data showed COVID-19 mortality was 5 times higher for low- vs. high-socioeconomic-position adults (72.2 vs. 14.6 deaths per 100,000; RR = 4.94). [29] The joint effect of low SEP, Hispanic ethnicity, and male gender produced a death rate 27.4 times higher than high-SEP White women. [29] Poor-income adults had 55% lower odds of vaccination compared to high-income adults. [30]
Critically, vaccination coverage mediated a substantial portion of the poverty-mortality link. A county-level analysis found that if vaccination rates had been set to their maximum observed values, 81% of the poverty–mortality association would have been eliminated. [31] Structural equation modeling estimated that vaccination coverage mediated 30.6% of total COVID-19 case-fatality disparity attributable to social vulnerability. [30]
Insurance status
Uninsured patients had 43% higher adjusted odds of in-hospital death (aOR = 1.43, 95% CI 1.26–1.62) compared to privately insured patients. [30] Adults without health insurance had a booster dose rate of only 17.4% vs. 51.9% among insured adults. [17] One analysis estimated that universal health insurance coverage could have prevented approximately 60,000 fewer COVID-19 deaths (26% of the total) in the pre-vaccine period alone. [32]
Education
Education was independently associated with both vaccination uptake and mortality. A JAMA Network Open study found that if all groups had experienced the mortality rate of college-educated non-Hispanic White individuals, 48% of all COVID-19 deaths would have been averted. [21] Notably, education did not fully explain racial disparities: college-educated non-Hispanic Black men still had higher COVID-19 mortality than non-Hispanic White men with ≤high school education. [21]
Disability, homelessness, and incarceration
Adults with disabilities were 12% less likely to have received ≥1 dose despite being 86% more likely to say they would “definitely” get vaccinated and 2.7 times more likely to report difficulty accessing vaccination — highlighting access barriers rather than hesitancy. [30] People experiencing homelessness had pooled first-dose coverage of only 43% (95% CI 35–51%) and nearly twice the risk of COVID-19 death compared to the general population. [33-34] Incarcerated populations experienced 5.5 times higher COVID-19 incidence and 3 times higher age-sex-adjusted mortality compared to the general population, with racial disparities persisting within carceral settings. [7]
Intersecting Vulnerabilities
These demographic dimensions are deeply intertwined and mutually reinforcing. Rural areas are disproportionately Republican-leaning, have lower vaccination rates, higher poverty, worse pre-pandemic health, and less healthcare access. In county-level models of Delta-wave mortality, Trump vote share had the largest effect size, followed by age composition, poverty rate, and vaccination rate. [24] The intersection of multiple social determinants produced compounding effects: the joint impact of being uninsured, food-insecure, and a racial minority simultaneously created vaccination likelihood differentials of 43–48 percentage points. [25]
A unifying finding across all demographic dimensions is that vaccination disparities functioned as a key mediating pathway through which pre-existing social vulnerability translated into excess COVID-19 mortality. Equalizing vaccination to the 90th percentile of observed rates would have eliminated 37% of the poverty–mortality association. [31] In Los Angeles, a 20% increase in community vaccination produced an additional 8.1% reduction in COVID-19 incidence in the lowest-income communities compared to the highest-income communities, suggesting vaccination had the greatest marginal benefit in the most disadvantaged areas. [34]
Summary
Vaccine-preventable COVID-19 deaths in the United States were not randomly distributed. They were concentrated among older adults (≥65 years accounted for ~75% of deaths), racial/ethnic minorities (AI/AN, NH/OPI, Black, and Hispanic populations had 1.5–2× higher age-adjusted mortality rates), Southern and rural communities (52% higher mortality in the most remote rural counties), Republican-leaning populations (43% higher excess death rate after vaccine availability), and socioeconomically disadvantaged groups (5× higher mortality in low- vs. high-SEP adults). These dimensions overlapped substantially, with vaccination coverage serving as a critical mediating pathway through which pre-existing structural inequities translated into preventable deaths. The absence of a single national study providing fully stratified preventable death counts across all demographic dimensions simultaneously remains an important evidence gap.
Would you like to explore the specific mechanisms through which political partisanship influenced vaccine hesitancy and uptake — including the roles of media consumption, misinformation, and trust in institutions?
Disparities in COVID-19 Mortality in the United States, 2020-2023.
BMC Public Health. 2025. Abidin ZU, Thirumalareddy J, Gupta JS, Abdul Jabbar AB.
JAMA Internal Medicine. 2026. Koumans EHA, Khan D, Trejo I, et al.
COVID-19 Mortality Update - United States, 2022.
MMWR. Morbidity and Mortality Weekly Report. 2023. Ahmad FB, Cisewski JA, Xu J, Anderson RN.
Provisional Mortality Data - United States, 2020.
MMWR. Morbidity and Mortality Weekly Report. 2021. Ahmad FB, Cisewski JA, Miniño A, Anderson RN.
Lancet. 2025. GBD 2023 Causes of Death Collaborators.Modeling
Provisional Mortality Data - United States, 2022.
MMWR. Morbidity and Mortality Weekly Report. 2023. Ahmad FB, Cisewski JA, Xu J, Anderson RN.
Provisional Mortality Data - United States, 2021.
MMWR. Morbidity and Mortality Weekly Report. 2022. Ahmad FB, Cisewski JA, Anderson RN.
MMWR. Morbidity and Mortality Weekly Report. 2022. Ward LA, Black KP, Britton CL, Tompkins ML, Provost EM.
COVID-19 Mortality Among American Indian and Alaska Native Persons - 14 States, January-June 2020.
MMWR. Morbidity and Mortality Weekly Report. 2020. Arrazola J, Masiello MM, Joshi S, et al.
JAMA Network Open. 2021. Acosta AM, Garg S, Pham H, et al.Observational
Significant Impacts of the COVID-19 Pandemic on Race/Ethnic Differences in US Mortality.
Proceedings of the National Academy of Sciences of the United States of America. 2022. Aburto JM, Tilstra AM, Floridi G, Dowd JB.
Proceedings of the National Academy of Sciences of the United States of America. 2021. Andrasfay T, Goldman N.
JAMA Network Open. 2021. Andrasfay T, Goldman N.
PloS One. 2022. Andrasfay T, Goldman N.
American Journal of Epidemiology. 2024. Masters RK, Aron LY, Woolf SH.
Excess Death Rates by State During the COVID-19 Pandemic: United States, 2020‒2023.
American Journal of Public Health. 2024. Woolf SH, Lee JH, Chapman DA, Sabo RT, Zimmerman E.
Lancet. 2022. COVID-19 Excess Mortality Collaborators.SR
eLife. 2023. Lee WE, Woo Park S, Weinberger DM, et al.
Lancet Regional Health. Americas. 2021. Iuliano AD, Chang HH, Patel NN, et al.
Lancet. 2023. Bollyky TJ, Castro E, Aravkin AY, et al.Observational
Mortality in the United States - Provisional Data, 2023.
MMWR. Morbidity and Mortality Weekly Report. 2024. Ahmad FB, Cisewski JA, Anderson RN.
MMWR. Morbidity and Mortality Weekly Report. 2020. Rossen LM, Branum AM, Ahmad FB, Sutton P, Anderson RN.
Excess Deaths in the United States During the First Year of COVID-19.
Preventive Medicine. 2022. Ruhm CJ.
American Journal of Epidemiology. 2024. Kandula S, Kristoffersen AB, Rø G, LeBlanc M, de Blasio BF.
MMWR. Morbidity and Mortality Weekly Report. 2023. Johnson AG, Linde L, Ali AR, et al.
Estimated Preventable COVID-19-associated Deaths Due to Non-Vaccination in the United States.
European Journal of Epidemiology. 2023. Jia KM, Hanage WP, Lipsitch M, et al.
JAMA Internal Medicine. 2023. Wallace J, Goldsmith-Pinkham P, Schwartz JL.Observational
American Journal of Health Promotion : AJHP. 2026. Novak AM, Amir Y.New
MMWR. Morbidity and Mortality Weekly Report. 2024. Panagiotakopoulos L, Moulia DL, Godfrey M, et al.Guideline
JAMA Network Open. 2022. Steele MK, Couture A, Reed C, et al.Modeling
MMWR. Morbidity and Mortality Weekly Report. 2023. DeCuir J, Surie D, Zhu Y, et al.
Development of COVID-19 Vaccine Policy - United States, 2020-2023.
Vaccine. 2024. Oliver SE, Wallace M, Twentyman E, et al.
MMWR. Morbidity and Mortality Weekly Report. 2021. Christie A, Henley SJ, Mattocks L, et al.
MMWR. Morbidity and Mortality Weekly Report. 2022. Johnson AG, Amin AB, Ali AR, et al.
